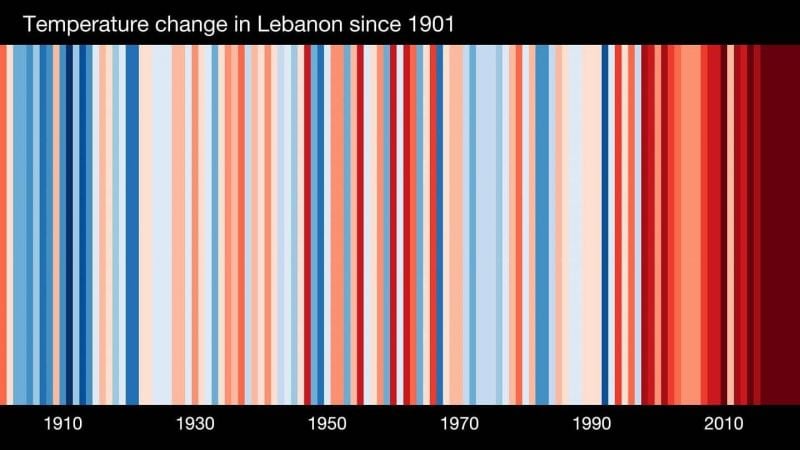
Lebanon's "warming stripes" int he last 100-plus years, according to the University of Reading in England. (Courtesy of the University of Reading).
BEIRUT — Visuals called the “warming stripes,” created by the University of Reading in England, show how climate change is contributing to stark rising temperatures in Lebanon over the past 100-plus years.
Each stripe or bar on the infographic represents the temperature in Lebanon averaged over one year. Over the past 100-plus years, the graph exhibits a shift from deeper blue colors — representing years that were significantly cooler than the long-term average — to deeper red colors — representing years that were significantly warmer than the long-term average.
The stripes on the graph start in 1901 and finish in 2021, communicating data of average temperatures from those years. Graphs of “warming stripes” were created for each country in the world.
Data of average temperatures from the year 2021 was paired with the data from previous years and published on Tuesday, which was “Show Your Stripes” Day, an observance created five years ago to raise awareness for climate change. The day was created to coincide with the first day of summer, June 21.
According to the University of Reading, thousands of people around the world, television meteorologists, major organizations have shared stripes of their country or displayed them in an ingenious way — like on a T-shirt or one’s car.
The data is retrieved from the Berkeley Earth Surface Temperatures data set and the visuals were created in 2018 by climate scientist Ed Hawkins, who is based at the University of Reading.
This staggering shift paints a bold picture of rapid and increasingly warming temperatures in the small Mediterranean country. The trend is similar to that in other countries in the Middle East as well as around the globe: palpable warming of temperatures in recent decades.
Milad Fakhri, the director of the National Center for Marine Sciences, which is part of the National Council for Scientific Research in Lebanon, told L’Orient Today that the country has been witnessing extreme heat waves in recent years but that further data and monitoring is needed before a credible trend for rising temperatures is published.
Fakhri explained that rising air temperatures impact sea temperatures, which in turn leads to “major repercussions on the marine environment and many marine organisms,” some of which the Lebanese economy depends on.
The National Council for Scientific Research is a public institution which depends on governmental funding, which has been dwindling due to the three-year deepening economic and financial crisis. Fakhri told L’Orient Today that tools, which the scientific institution uses to monitor rising sea temperatures and ocean acidification, requires repairing “but funding from the government for this is currently lacking.”
The Environment Ministry estimated that climate change will cost the country “a 14 percent drop in Lebanon’s GDP by 2040, falling further to 32 percent by 2080,” according to Najat Rochdi, the UN Resident & Humanitarian Coordinator for Lebanon.
Rochdi added in her report that “in terms of livelihoods, climate change is expected to increase temperatures and make water resources scarcer.”